My name is Nemanja Đordan. I am a straightforward person – I will work for you in exchange for money. Some of the skills that I possess are listed below.
Technologies
-
SQL

-
MySQL

-
Tableau

-
Excel

-
Python

-
HTML

-
CSS

-
JavaScript

-
Jira

-
Photoshop

-
Illustrator

Portfolio
-
Netflix Movies & TV Series
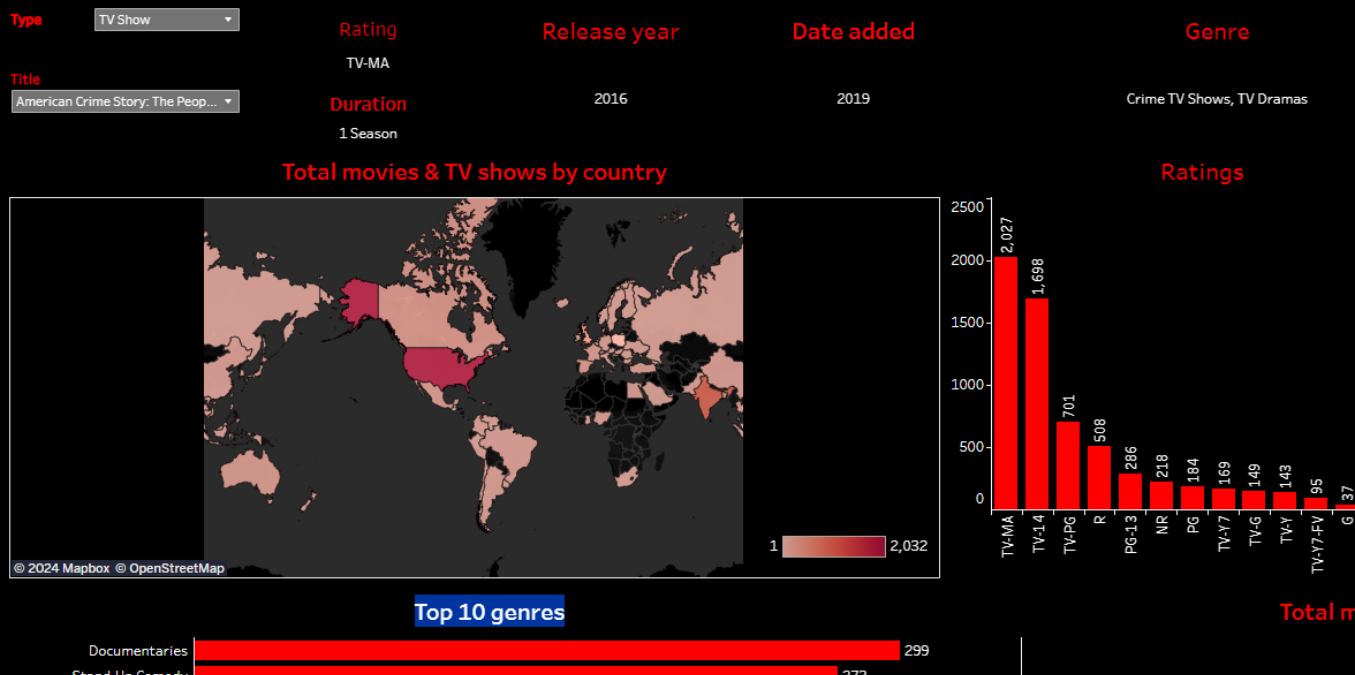
This Tableau dashboard provides a comprehensive overview of Netflix's content library, exploring key aspects such as ratings, release dates, and genre distribution. It visualizes the distribution of movies and TV shows across different countries and tracks how the volume of content has evolved over the years. Additionally, the dashboard highlights the top genres available on the platform, offering valuable insights into Netflix's global content trends.
-
Sales Dashboard
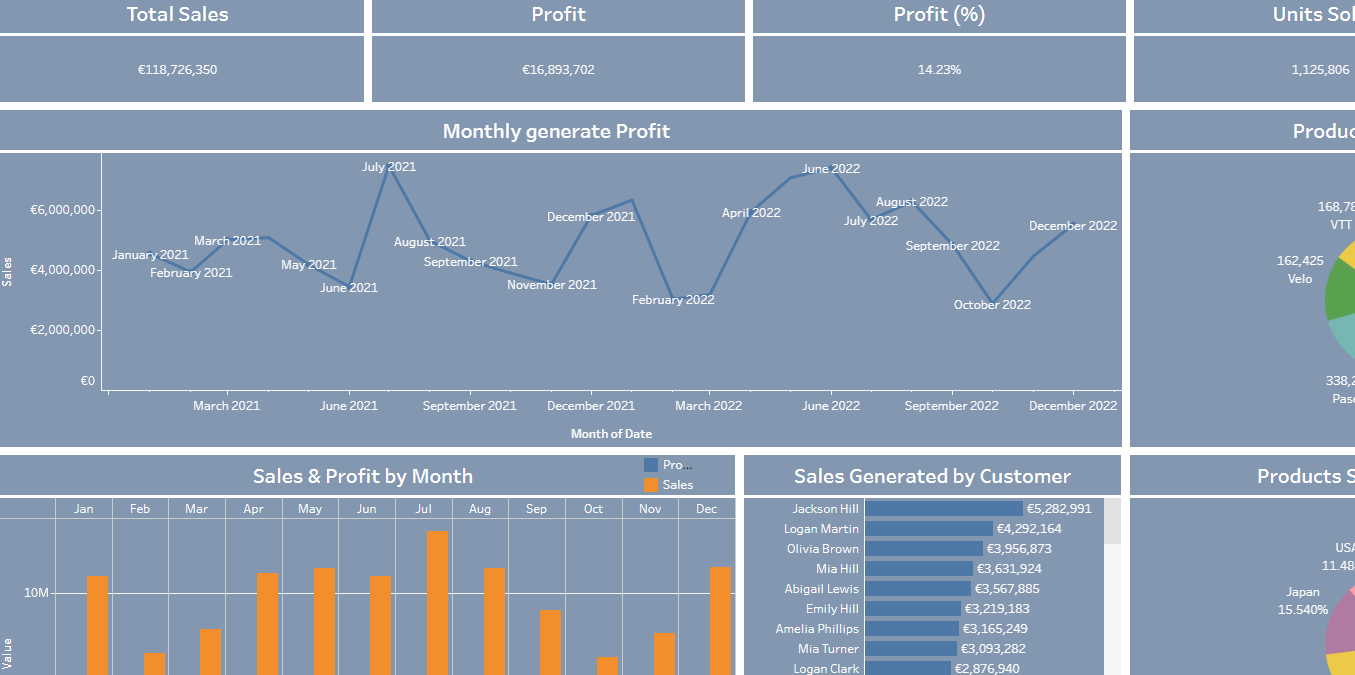
This Tableau dashboard provides an insightful overview of key business metrics, including overall profit, sales, and units sold. It highlights monthly profit trends, customer-driven sales, and the distribution of product sales across different countries. Additionally, it offers a clear view of how various products perform in terms of units sold, enabling data-driven decision-making.
-
Anime 2023
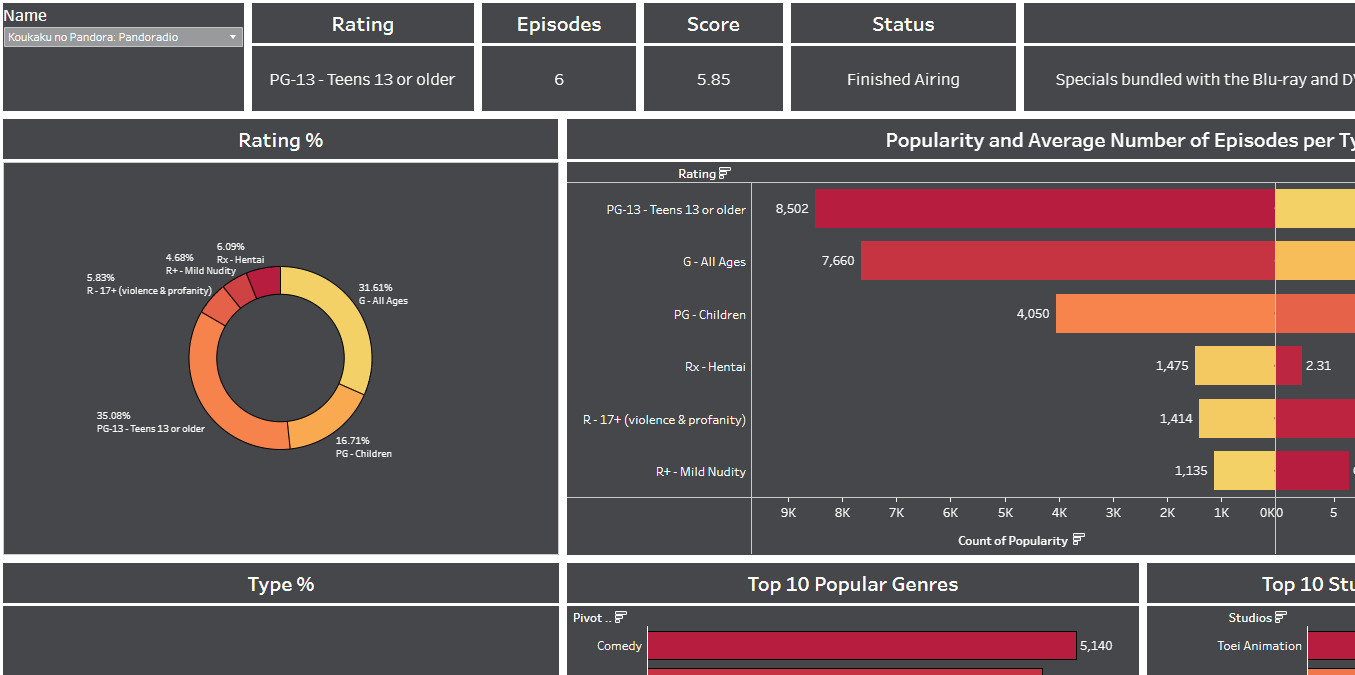
The Tableau dashboard on anime up to the year 2023 provides an in-depth analysis of various aspects of anime titles. It covers key details such as the anime's name in different languages, its score, genres, and a brief synopsis. The dashboard also highlights important information like the number of episodes, premiere dates, and airing status. Additional insights include data on production studios, licensors, and source material, as well as audience engagement metrics like popularity, favorites, and user scores. This comprehensive dashboard offers a clear view of the anime landscape across different dimensions.
-
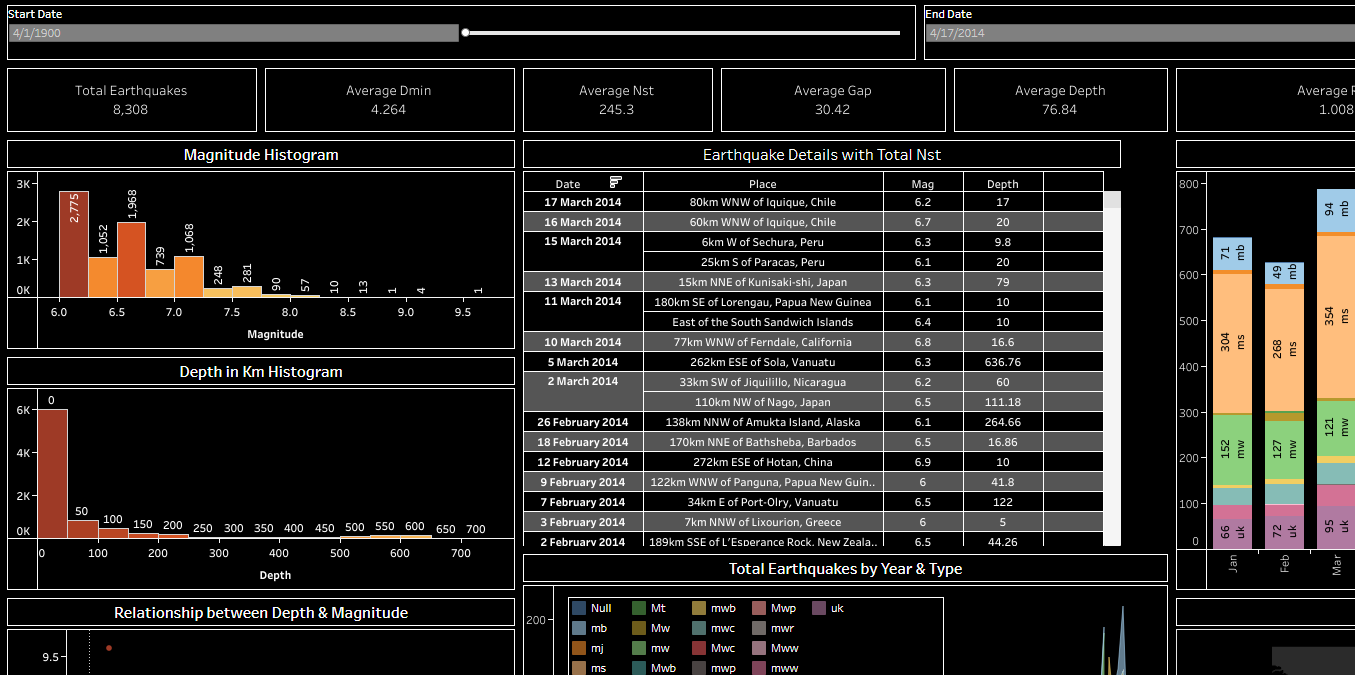
Earthquakes 1900-2013
This Tableau dashboard is about earthquakes from 1900 to 2013, and provides an in-depth visualization of seismic events over this period.
-
McDonald's Menu
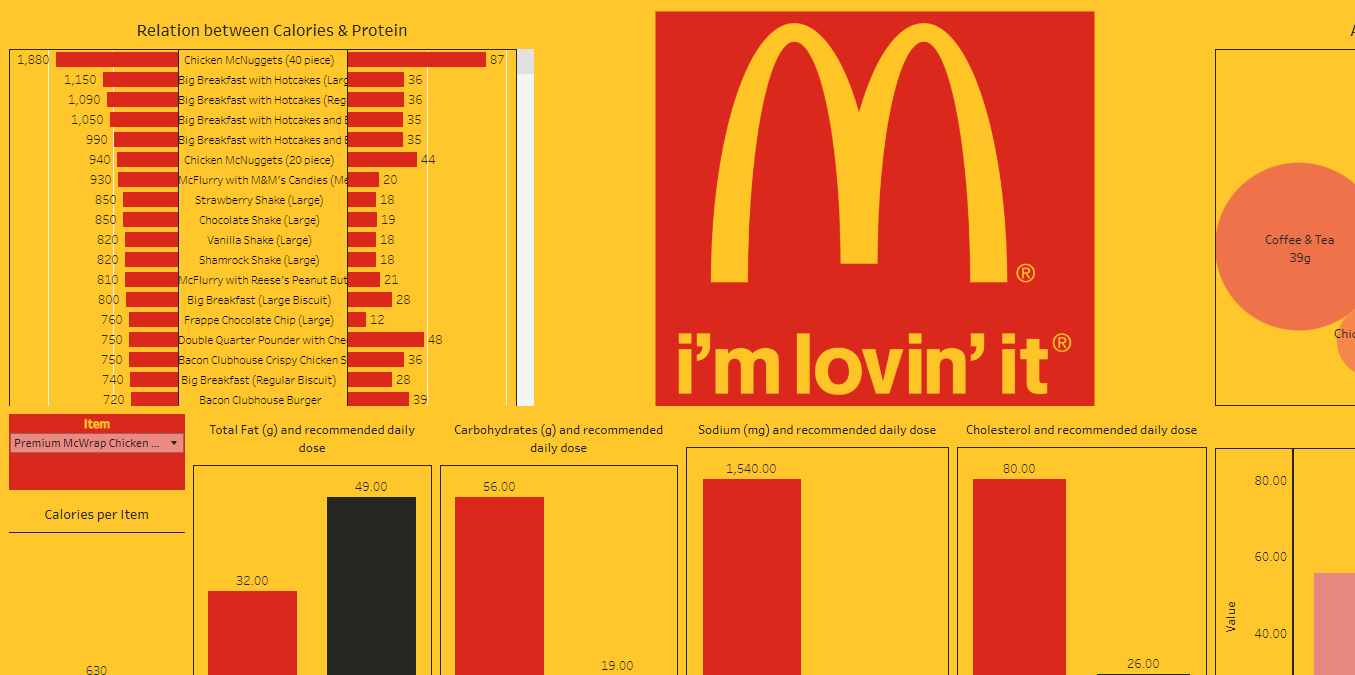
The Tableau dashboard provides a detailed analysis of McDonald's menu items, focusing on their nutritional content. This visual representation helps users better understand the nutritional breakdown of McDonald's offerings.
